
Weather and climate

CITE
We have made every effort to follow citation style rules, but there may be some minor differences. If in doubt, please refer to the appropriate citation style manual.
Weather forecasting. (2026). In Q-files Encyclopedia, Earth, Weather and climate. Retrieved from
https://www.q-files.com/earth/weather-and-climate/weather-forecasting
"Weather forecasting." Earth, Weather and climate, Q-files Encyclopedia, 6 Mar. 2026.
https://www.q-files.com/earth/weather-and-climate/weather-forecasting.
Accessed 6 Aug. 2026.
Weather forecasting 2026. Earth, Weather and climate. Retrieved 6 August 2026, from
https://www.q-files.com/earth/weather-and-climate/weather-forecasting
Earth, Weather and climate, s.v. "Weather forecasting," accessed August 6, 2026.
https://www.q-files.com/earth/weather-and-climate/weather-forecasting


Weather forecasting
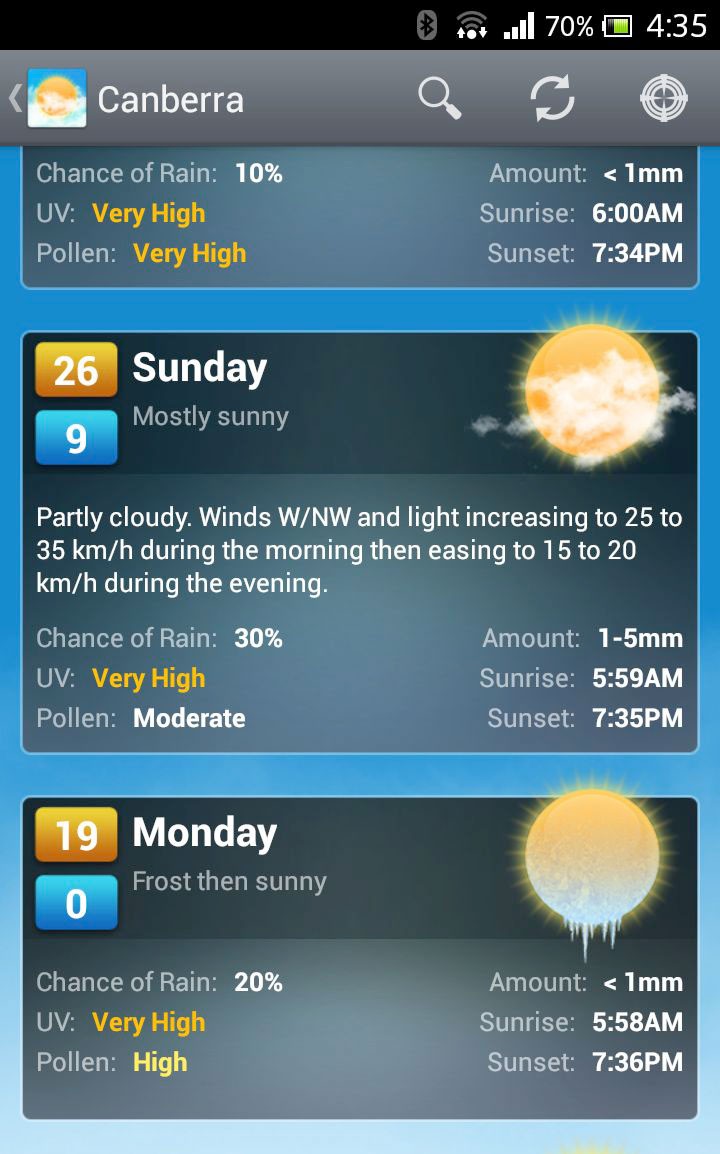
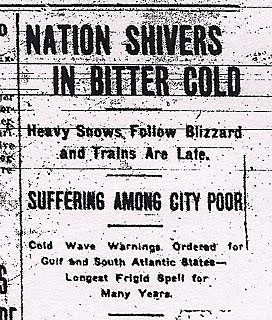
Scientists who study the weather are called meteorologists. They study how heat from the Sun, atmospheric pressure, wind and the water cycle interact with each other to create our weather. With the help of technology such as satellites and supercomputers, weather forecasts—predictions of future weather conditions in a particular place—are becoming more and more accurate. This type of weather forecasting is called numerical weather prediction (NWP). But the weather can often be unpredictable. Meteorologists can only make predictions for five or six days ahead with any detail or accuracy. Longer-term forecasts are usually based on average weather conditions for the time of year. Today, we can find out the weather forecast from radio and television bulletins, newspapers, websites, weather apps and public screens and boards.
Why forecast the weather?
People have tried to predict the weather since prehistoric times, when they first understood that the availability of food—for example, the arrival of migrating animals and the ripening of fruit—as well as their need for particular shelter and clothing, were closely linked to the weather. Today most of us still like to know what the weather will be so that we can plan what to wear and whether to take a trip to the seaside.
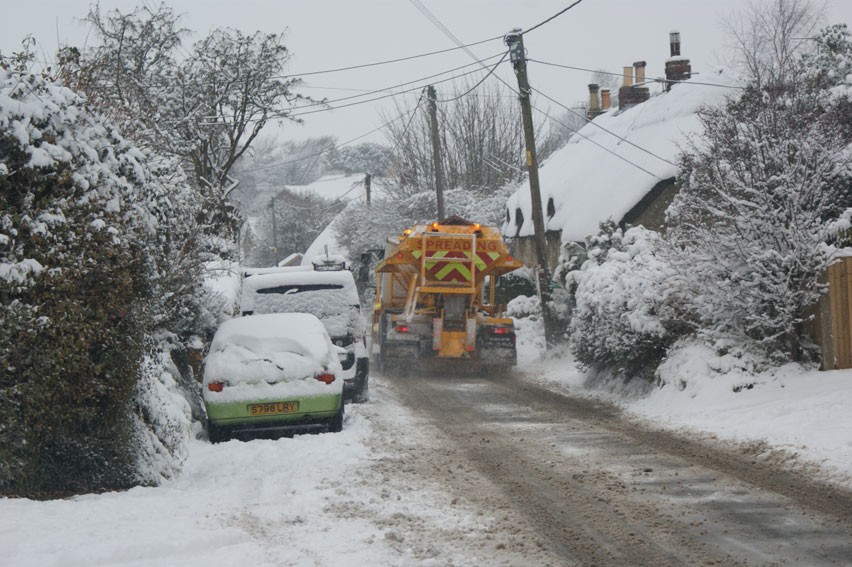
Many businesses and organizations are dependent on the weather to some extent. Farmers want to know the weather over the coming seasons, so they can plan for planting, harvesting and herding. Businesses such as supermarkets, leisure services, airlines and other transport companies, and gas and electricity suppliers need to know the forecast: will everyone want to buy barbecue sausages, will storms cause transport chaos, or will people stay at home and turn on the heating? Governments and emergency services need to put plans in place if severe weather is on the way.
History of forecasting
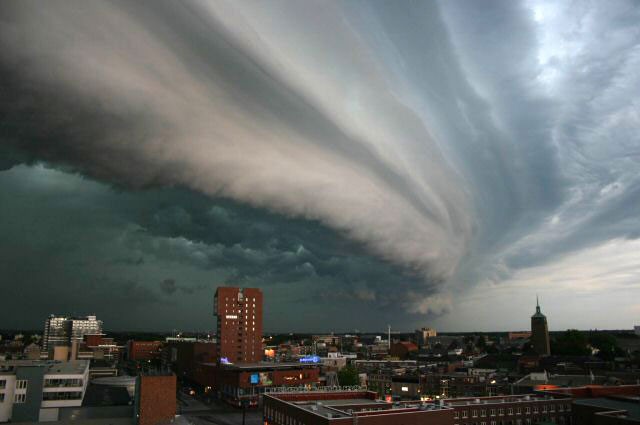
Long before the development of modern forecasting technology, people relied on observations and folklore to predict the weather. Before scientists first comprehended the existence of water vapour in the air, people correctly spotted a link between cloud types and rain or storms. Sailors and farmers made up rhymes to remember how wind from different directions affected weather. They also noted the behaviour of animals: for example, that seagulls tend to roost when rain is on the way (we now know this is because low air pressure makes it harder for birds to fly).
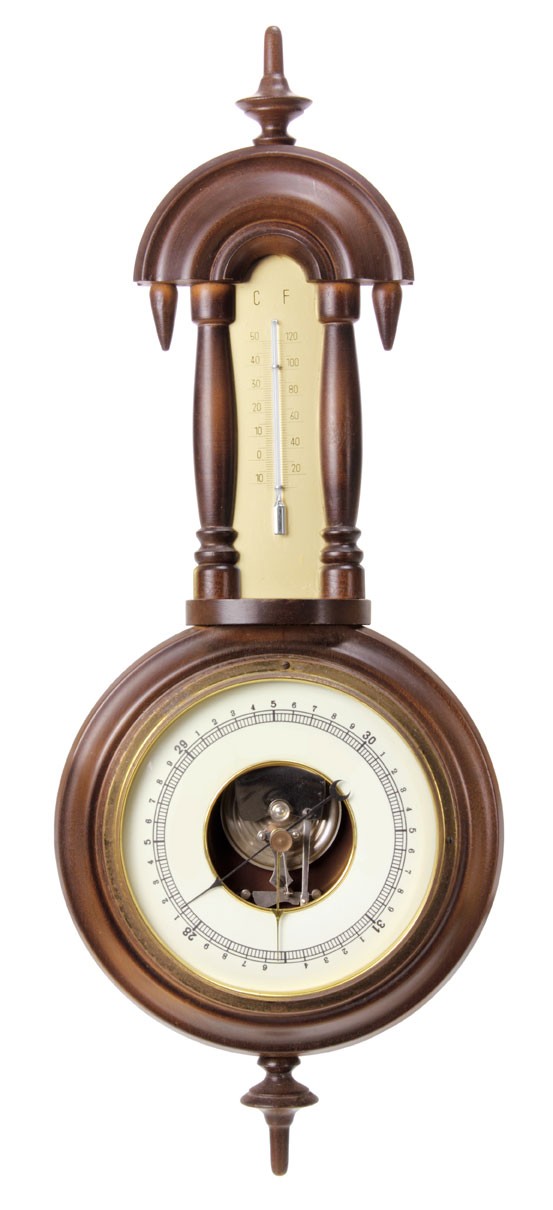
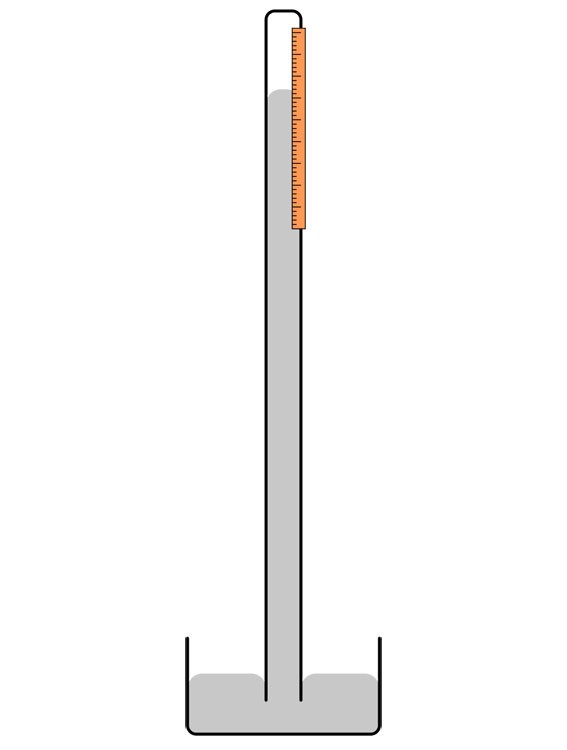
Thanks to new inventions from the mid-17th century onwards, weather forecasting began to develop into a science. The barometer, which measures atmospheric pressure, was invented by Evangelista Torricelli in 1643. The hygrometer, measuring humidity, was developed by Francesco Folli in 1664. The mercury thermometer was invented by Daniel Fahrenheit in 1714. In 1831, when the electric telegraph was invented by Samuel Morse, it became possible to send observations and warnings from one place to another instantly.
Weather stations
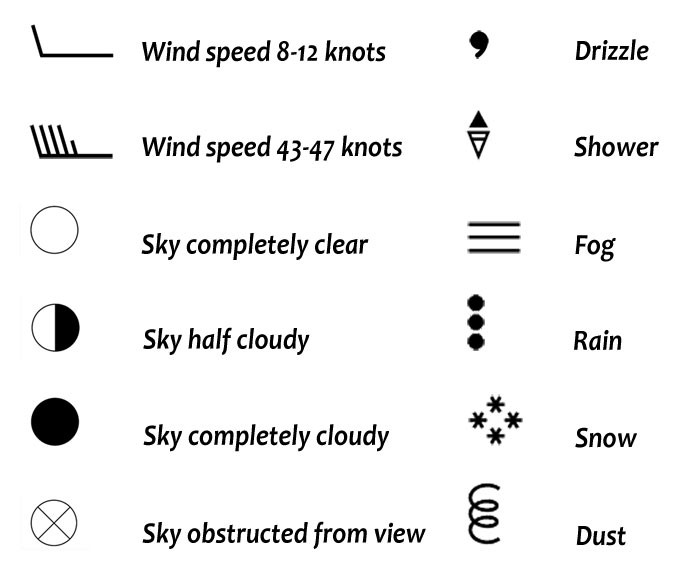
Thousands of local weather stations—on land and at sea—collect information about atmospheric conditions at their location. Some weather stations are staffed by people, while others are automated: they rely on sensors to collect and transmit information. In each country, the national weather service runs a network of weather stations: for example, the Met Office runs them in the UK, and the National Oceanic and Atmospheric Administration (NOAA) in the USA. Many companies, universities and individuals also run stations. Since the information collected is shared globally, weather maps use internationally agreed symbols, and reports are given in Universal Time. The World Meteorological Organization (WMO) oversees their coordination.
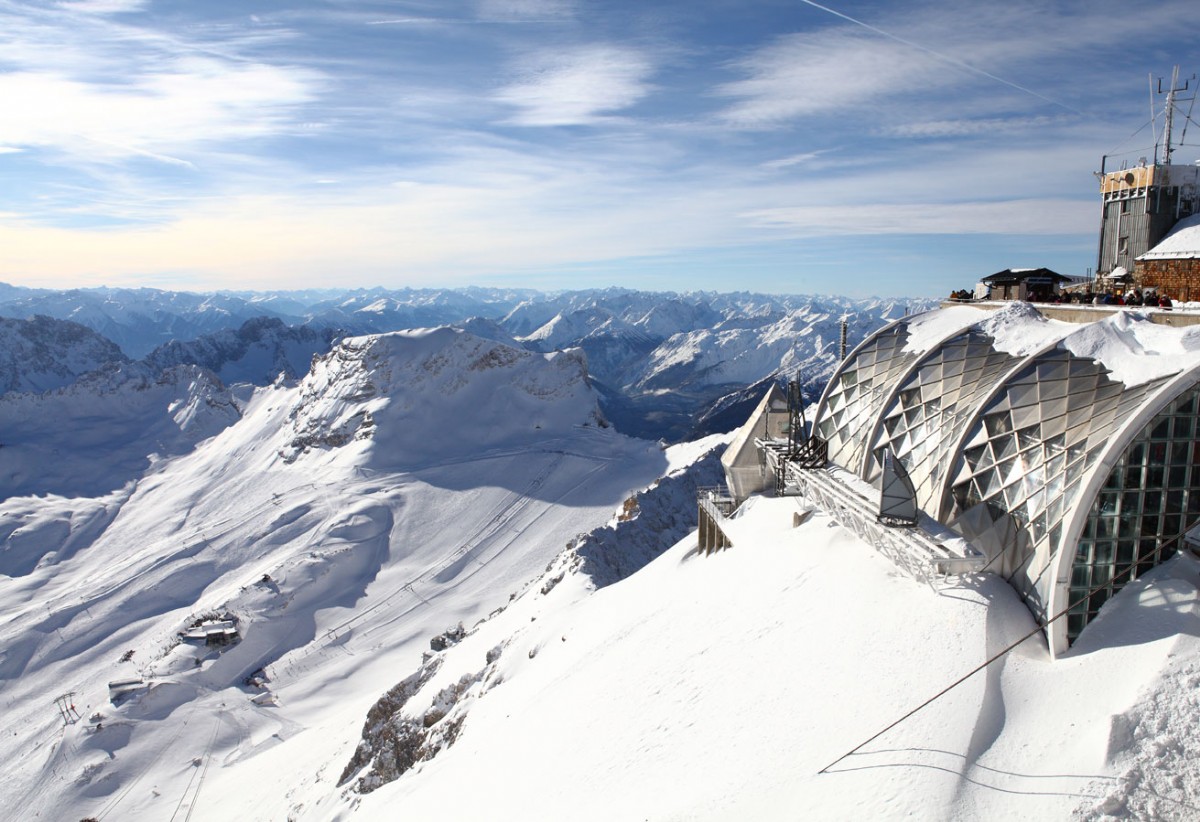
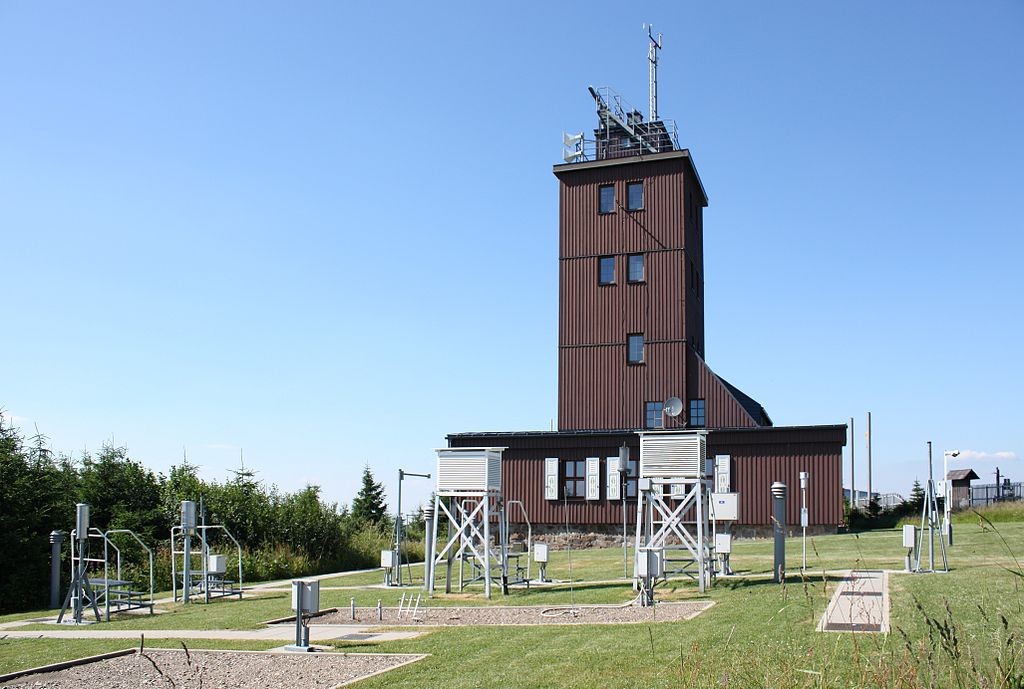
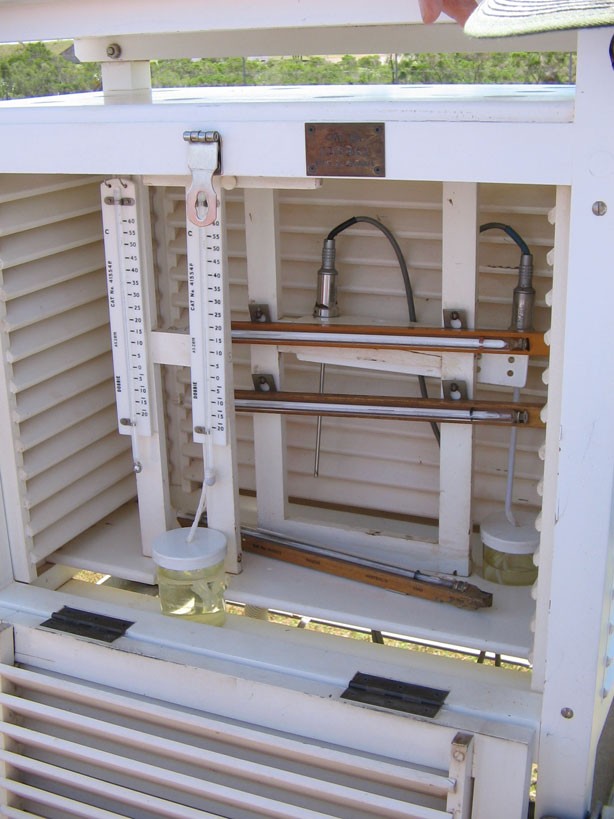
Weather stations contain some, or all of, these instruments: thermometer (to measure temperature), rain gauge and snow stake (to measure precipitation), barometer (to measure atmospheric pressure), hygrometer (to measure humidity), dewcell (for measuring dew point), anemometer (to measure wind speed and direction), psychrometer (to measure cooling caused by evaporation), disdrometer (to measure precipitation drop sizes), transmissometer (to measure visibility) and ceilometer (to measure cloud height). Measurements are taken at set times.
Weather satellites
The first weather satellite, Vanguard 2, was launched by NASA in 1959. Today there are more than a dozen weather satellites in orbit around the Earth, operated by Europe, the USA, Russia, China, Japan and India. Most of these satellites are geostationary, which means that they orbit the Equator at the same rate that the Earth spins. This allows them to constantly monitor the same large area, around 40% of the Earth’s surface. In order to get a better view of polar regions, some weather satellites are polar orbiting: they pass over the north and south poles with each revolution. The Coordination Group for Meteorological Satellites (CGMS) helps with sharing information between different countries.
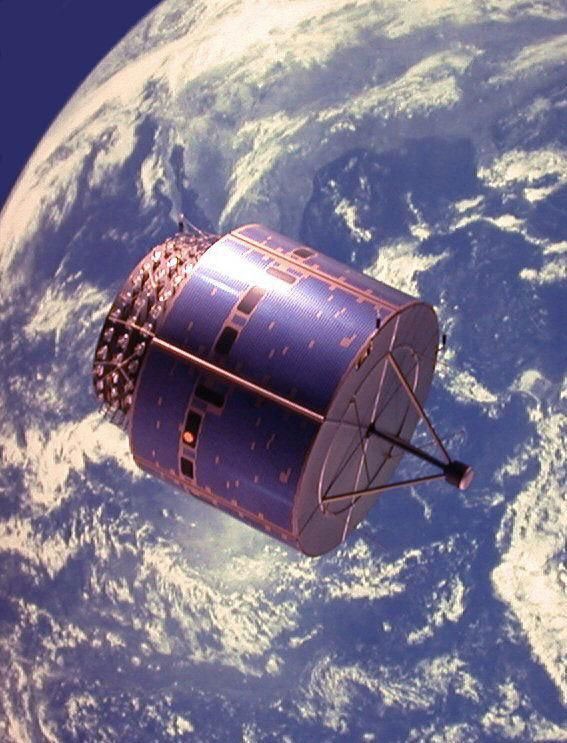
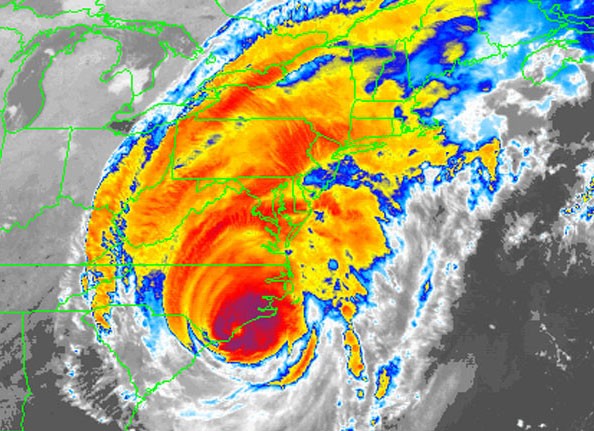
Visible light spectrum images (“normal” camera images) from satellites can show clouds, tropical storms, dust storms, pollution, ice floes and snow cover. By examining a series of images, it is possible to follow the movements of warm and cold fronts and to assess wind speed and direction. Satellites can also capture thermal or infrared images. These allow meteorologists to determine cloud heights and types, land and water temperatures, and to follow ocean currents.
Radar

Since the 1950s, weather radar has been used to locate precipitation (such as rain or snow) and work out its type, speed, direction and intensity. Radio waves are sent out from an antenna. The radio waves are either scattered or reflected back to the antenna by objects they meet in the air. If the waves meet rain or snow, the scattering or reflection of the waves allows an analyst to build up a picture.
Weather balloons
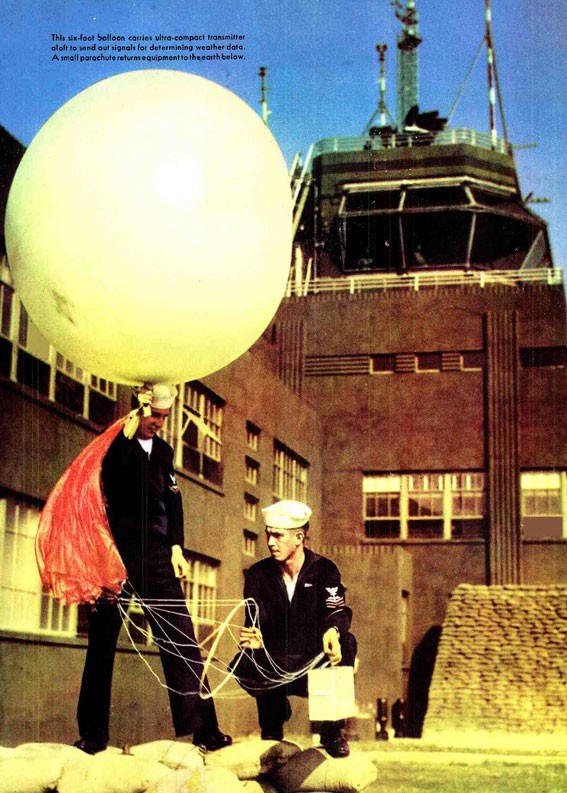
The first simple weather balloons were launched in France in 1892. Today, around 2000 balloons are launched every day. A weather balloon is 2 metres (6 feet) in diameter and filled with lighter-than-air hydrogen or helium. Each balloon is equipped with a package of instruments called a radiosonde. The instruments measure wind speed and direction, air pressure, humidity and temperature in the upper atmosphere, a region that other forms of weather technology cannot reach. The radiosonde transmits the data by radio. International agreements mean that most countries share information from their radiosondes. If a balloon goes so high that the temperature falls to less than -90°C (-130°F), it will pop and the radiosonde is parachuted back to Earth so that it does not cause injury.

Supercomputers
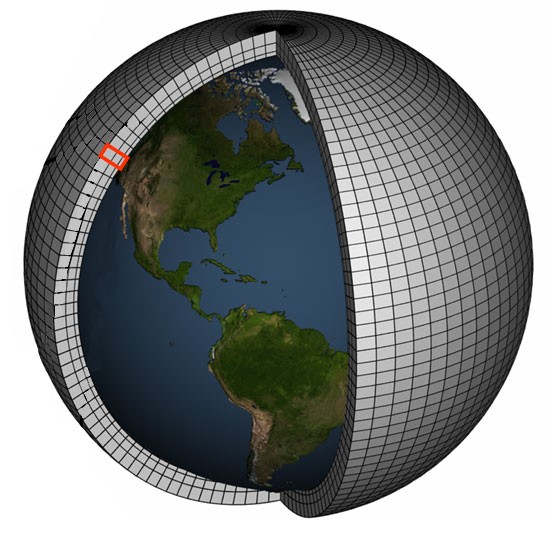
The major national weather services use supercomputers, which are powerful enough to make more than 1000 trillion calculations each second. Every day these computers are fed thousands of weather observations from weather stations, balloons, radar and satellites. This data is used to work out how the atmosphere and oceans may behave in the future. A computerized weather model contains more than a million lines of code. Today, supercomputers give very accurate short-term forecasts, up to about four days in advance, and can also predict longer-term weather and climate patterns—for example, the arrival and intensity of the hurricane season in the USA.
Numerical weather prediction (NWP), using supercomputers and specialized software, still takes hours to build a picture of the weather a few days ahead. Artificial Intelligence (AI) can perform this task much more accurately and in a fraction of the time. AI models are fed 40 years’ worth of meteorological data, along with measurements of pressure, temperature and wind speed taken six hours earlier, and deliver their forecasts based on those inputs alone.
Understanding weather forecasts
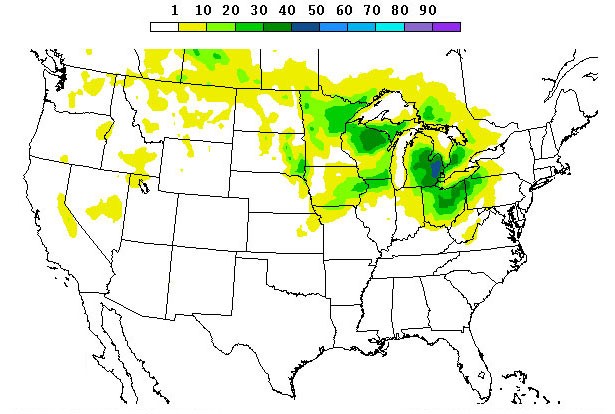
Meteorologists use probabilities when they are forecasting precipitation. This is because so many factors affect precipitation that it is usually impossible to say whether it will definitely rain tomorrow afternoon—only how likely (probable) it is to rain. If a weather forecaster says there is a 10% chance of snow, that means it is unlikely to snow. If they say there is an 80–100% chance of rain tomorrow, that means the atmospheric conditions make it almost certain to rain at some point during the day.
During warm weather, forecasts may include the “pollen count” (the number of grains of pollen in a cubic metre of air), which is useful information for people with hay fever; and the “solar UV index”, which is the likelihood of sunburn, dependent on the position of the sun and cloud cover. The “air quality index” is a measure of pollutants in the atmosphere and is useful for people with asthma or other breathing problems.

“Wind chill” is a measure of how cold it will feel because of wind speed: the wind chill temperature is always lower than the actual air temperature. Severe weather warnings alert people to the risk of floods or storms, often rated from yellow (“be aware”), through amber (“be prepared”) to red (“take action”). Some services also issue warnings of the risk of forest fires or avalanches.
Weather maps
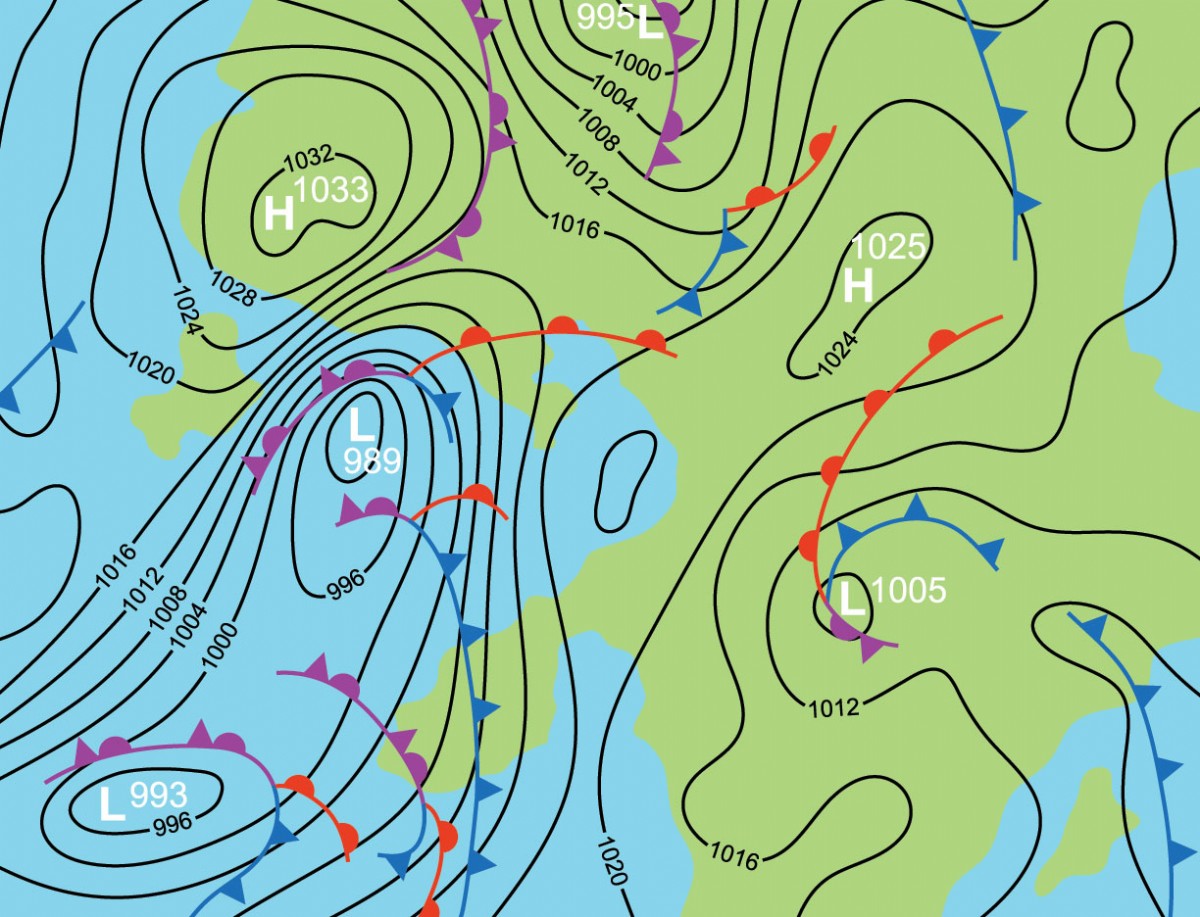
Many weather maps on television and the internet are simplified, but you may come across a traditional weather map, which shows patterns of low and high pressure. Lines called isobars link points with equal atmospheric pressure. High-pressure systems are often marked with an H and low-pressure systems with an L. Fronts are represented by lines marking the boundary of the front. Cold fronts have triangles along the length of the line while warm fronts have semicircles. Winds tend to blow along the line of the isobars, turning slightly towards a low and away from a high in the northern hemisphere (and the opposite in the southern hemisphere). The closer together the isobars, the stronger the winds.
Consultant: Ian Fairchild
pics
Without in any way limiting Q-files Ltd’s exclusive rights under copyright, any use of this publication to “train” generative artificial intelligence (AI) technologies to generate text is expressly prohibited. Q-files Ltd reserves all rights to license use of this work for generative AI training and development of machine learning language models.